
Server and endpoint monitoring with Prometheus and Grafana

Prometheus is a very nice open-source monitoring system for recording real-time metrics (and providing real-time alerts) in a time-series database for a variety of purposes.
Here we're going to setup Prometheus on a server to monitor a wealth of statistics (such as CPU/memory/disk usage, disk IOps, network traffic, TCP connections , timesync drift, etc.) as well as monitor several endpoints (which could be web applications or services like bitwarden, rocketchat, gitlab, etc.).
We'll also setup a simple dashboard with Grafana, another (great) open-source visualisation and analytics platform that integrates fantastically with (and out-of-the-box) with Prometheus. This will provide a nice dashboard that we'll use to quickly see the status of the endpoints we're monitoring.
An example can be seen at https://mon.jaytaala.com.
A bit about Blackbox Exporter, Node_Exporter and Grafana...
Installing and configuring Prometheus, Blackbox exporter, and Grafana with Docker-Compose
I'm assuming you are running an up-to-date Linux distro and you have Docker and Docker Compose installed (if not, you'll need to install Docker and then Docker Compose).
Thanks to Docker and Docker Compose, we'll only need to run a single command to deploy Prometheus, an exporter (which can query endpoints), and Grafana. Let's start by cloning our setup files from my git repo:
https://gitlab.jaytaala.com/docker/docker-compose-prometheus-grafana
git clone https://gitlab.jaytaala.com/docker/docker-compose-prometheus-grafana.gitThe repo contains several files:
- blackbox-exporter.yml : configuration file for blackbox-exporter
- dashboard-blackbox.json : blackbox exporter dashboard I've customised see Adding monitoring dashboards;
- dashboard-node_exporter.json : node_exporter dashboard I've customised see Adding monitoring dashboards;
- docker-compose.yml : docker compose config file
- grafana.ini : grafana configuration file
- prometheus.yml : prometheus configuration file
Once you've cloned the repo, simply run (from within the cloned folder):
docker-compose up -dIf things worked as they should you should be able to visit the basic Grafana web interface at http:\\<INTERNAL-SERVER-IP>:3000.
That's it! that wasn't so bad was it?
Troubleshooting
If it fails it's most likely that port 3000 on the host is taken - in which case simply change the "ports" first value in docker-compose.yml to another port. E.g. for me I used:
    ports:
      - 4000:3000
Optional reading (explanation of configuration files)
Explanation of prometheus.yml
This file is the main Prometheus.yml scrape configuration file. It defines things like how often Prometheus should scrape (query) data and from where (and how) it should scrape this data.
# NOTE_1: Default scraping config for how often Prometheus should scrape.
global:
  #scrape_interval: 1m # Set the interval to scrape data. Default is every 1 minute.
  #evaluation_interval: 1m # Set interval to evaluate rules. The default is every 1 minute.
  #scrape_timeout: 10s # Set scrape timeout period. global default (10s).

# Alertmanager configuration
alerting:
  alertmanagers:
  - static_configs:
    - targets:
      # - alertmanager:9093

# Load rules once and periodically evaluate them according to the global 'evaluation_interval'.
rule_files:
  # - "first_rules.yml"
  # - "second_rules.yml"

# A scrape configuration containing exactly one endpoint to scrape:
# Here it's Prometheus itself.
scrape_configs:
  # The job name is added as a label `job=<job_name>` to any timeseries scraped from this config.

  # NOTE_2: Prometheus (by default) monitors itself and can report on
  # scrape query duration, samples added to db, data compaction stats.
  - job_name: 'prometheus'

    # metrics_path defaults to '/metrics'
    # scheme defaults to 'http'.

    static_configs:
    - targets: ['localhost:9090']

  # NOTE_3: scrape configutation for node_exporter, an exporter which
  # scrapes server machine metrics.
  #
  # NOTE_3_1: 10.0.0.137:10091 refers to the internal IP address
  # of the machine you want to monitor (and the port on which
  # node_exporter is running). This is NOT localhost (localhost
  # in this context is the Prometheus Docker container).
  - job_name: 'node_exporter'
    scrape_interval: 5s
    static_configs:
    - targets: ['10.0.0.137:10091']

  # NOTE_4: scrape configuration for blackbox, a prober that can probe
  # endpoints over HTTP, HTTPS, DNS, TCP and ICMP.
  - job_name: 'blackbox'
    scrape_timeout: 20s
    metrics_path: /probe
    params:
      module: [http_2xx]  # Look for a HTTP 200 response.
    static_configs:
      - targets:
        - https://example.com
        - https://startpage.com
    relabel_configs:
      - source_labels: [__address__]
        target_label: __param_target
      - source_labels: [__param_target]
        target_label: instance
      - target_label: __address__
        replacement: bbexp:9115  # The blackbox exporter's real hostname:port.
Explanation of grafana.ini
This file is the main grafana config file for our setup. It defines things server related settings, as well as settings we'll use to enable public viewing access.
# NOTE_1: defines server settings for our setup - including the port to bind/ and our domain name.
[server]
domain = domain.example.com

# NOTE_2: enable anonymous (public) viewer access to dashboards Viewer has access to.
[auth.anonymous]
enabled = true
# Organization name that should be used for unauthenticated users
org_name = example.com
# Role for unauthenticated users, other valid values are `Editor` and `Admin`
org_role = Viewermon.jaytaala.com. This is an external address for which I'm using a reverse proxy to secure (SSL) and route traffic to the internal 4000 port of Grafana. See Apache reverse-proxy SSL to multiple server applications for more information on how to implement this.Installing and configuring node_exporter (to monitor server stats)
By default node_exporter enables a large number of "collectors" (modules which collect certain information from the machine). See here for a list of collectors enabled by default (and what info they collect).
node_exporter can be run from a docker container, but it's not recommended since it should be run directly on the host hardware to collect stats.
Installing node_exporter can be done by downloading a recent version, untar'ing and executing. We're going to be doing an extra step here to manage node_exporter with systemd (so it starts on server boot etc.).
We start with downloading. You can find a link for the latest version at https://prometheus.io/download/#node_exporter. At the time of this writing the latest stable version for linux-amd64 was node_exporter-0.18.1.linux-amd64.tar.gz.
We'll download, untar, and then move it to /opt/node_exporter
wget https://github.com/prometheus/node_exporter/releases/download/v0.18.1/node_exporter-0.18.1.linux-amd64.tar.gz
tar -xf node_exporter-0.18.1.linux-amd64.tar.gz
sudo mv node_exporter-0.18.1.linux-amd64 /opt/node_exporter
With node_exporter installed let's make it easier to manage by creating a systemd service. Create a file in /etc/systemd/system/ with your favourite text editor (I'm using vim here):
sudo vim /etc/systemd/system/node_exporter.serviceand paste the following:
[Unit]
Description=Node Exporter
Wants=network-online.target
After=network-online.target

[Service]
Type=simple
ExecStart=/opt/node_exporter/node_exporter --web.listen-address=:10091

[Install]
WantedBy=multi-user.targetFinally let's enable it (to start on boot) and start the service
sudo systemctl daemon-reload
sudo systemctl enable --now node_exporter
We've already setup node_exporter in our prometheus configuration file (see lines 31 to 34).
- job_name: 'node_exporter'
  scrape_interval: 5s
  static_configs:
  - targets: ['10.0.0.137:10091']
prometheus.yml
Setting up Grafana data sources and dashboards
Adding Prometheus as a data source to Grafana
Once you have your docker containers running, access port 3000 on the server with a browser (e.g. visit http://192.168.0.1:3000 or whatever your internal address is for your server).
Grafana's login screen should appear - if you're the first user to login after creating this container then just enter any new credentials.
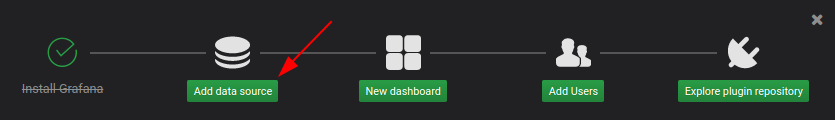
Once actually logged in, click on the "add data source" and select "Prometheus":
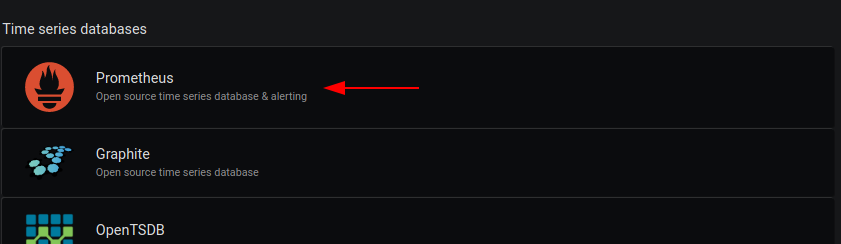
You can leave most setting as default and simply enter the docker-compose defined prom hostname with port 9090 for the Prometheus instance we have setup:

prom:9090 refers to the docker-compose defined hostname for our prometheus container.Adding monitoring dashboards
One of the great things with Grafana is that it is extremely easy to use (and publish) any dashboards that others have created. There's many (many) dashboards for different systems and many for prometheus and it's many exporters (like node_exporter, blackbox, etc.).
At mon.jaytaala.com I've used these dashboard (which I've then customised further to suit my needs):
- https://grafana.com/grafana/dashboards/7587 (for viewing blackbox http endpoint statuses);
- https://grafana.com/grafana/dashboards/1860 (for viewing server system stats);
You can see many other dasboards for grafana/prometheus here.
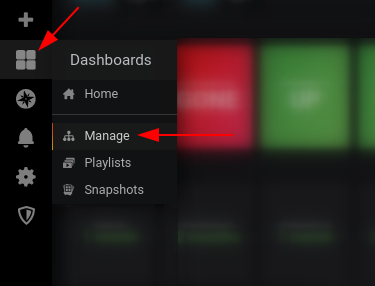
It's incredibly simple to add a dashboard to Grafana. Select the dashboards icon from the left menu and then select "Manage:
Now click the "import" button:

Either copy the link (e.g. https://grafana.com/grafana/dashboards/7587) or simply note the dashboard number (7587). Enter this into the "Grafana.com Dashboard" input and press the tab key:

Grafana will grab the dashboard and after a second or so will fetch the dashboard ready for importing. Enter a few options (see arrows) and then click "Import":
